All you need to start data analysis, well after figuring out what you want to study, is to find the data! I wanted to answer the question: “Could Michael Jodan play in today’s NBA?”.
I wanted to look at nba player stats from the years 1996-1998 (the Jordan-dominant years) and from 2017-2019 (today’s NBA). I got the data from nba.com and basketball-reference.com.
I actually ended up, mostly, copying-pasting data into an excel file and stack data from all the years together on top of eachother.
To read in the data, I stored my data files in github and I read the files through there:
statsbyyear <- read.csv("https://github.com/eisleyadore/eisleyadore.github.io/raw/master/data/statsbyyear.csv")Cleaning the data for this study, at least from the datasets I created, consisted of changing column names (can’t have column names start with numbers!), sorting by year, changing some datasets into long from wide format, etc.. I didn’t have to deal with missing data, as there was no missing data.
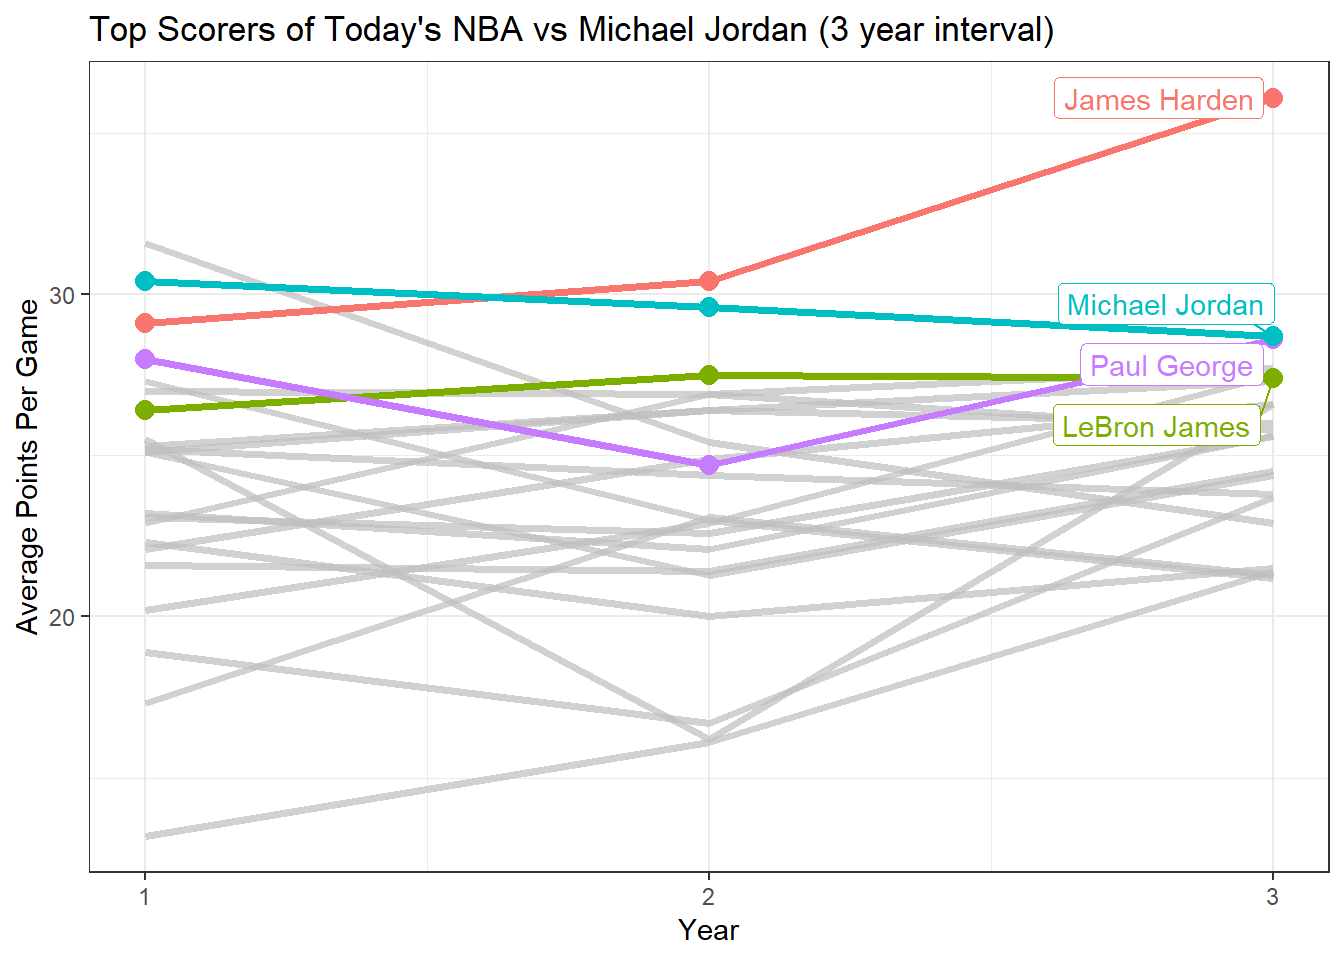
With the data, I ended up with some cool stuff, such as this graph that shows how Jordan’s (from 1996-1998) average points per game compared to top players in todays NBA (2017-2019).
I ended up switching my research topic to “The evolution of Three Point Shots in the NBA”, from my previous topic. However, I still ended up using the same datasets, while adding a few more years of nba data in between.