I wanted to see if three point percentage affect winning. Let’s try making a simple linear model:
threePointModel <- lm(GW ~THREEPP_100,data = stats_2019)
summary(threePointModel)
##
## Call:
## lm(formula = GW ~ THREEPP_100, data = stats_2019)
##
## Residuals:
## Min 1Q Median 3Q Max
## -21.7873 -5.8964 0.3398 7.7762 20.0635
##
## Coefficients:
## Estimate Std. Error t value Pr(>|t|)
## (Intercept) -110.234 44.371 -2.484 0.01923 *
## THREEPP_100 4.254 1.247 3.411 0.00198 **
## ---
## Signif. codes: 0 '***' 0.001 '**' 0.01 '*' 0.05 '.' 0.1 ' ' 1
##
## Residual standard error: 10.29 on 28 degrees of freedom
## Multiple R-squared: 0.2936, Adjusted R-squared: 0.2684
## F-statistic: 11.64 on 1 and 28 DF, p-value: 0.001983I try to explain Games Won (GW) by that team’s average Three Point field goal percentage (THREEPP_100) per game. I’m just looking at data from the most recent NBA regular season, 2018-2019. We can see from the model that as Three Point Percentage goes up by 1 percent, the number of games won by that team increasees by 4.25.
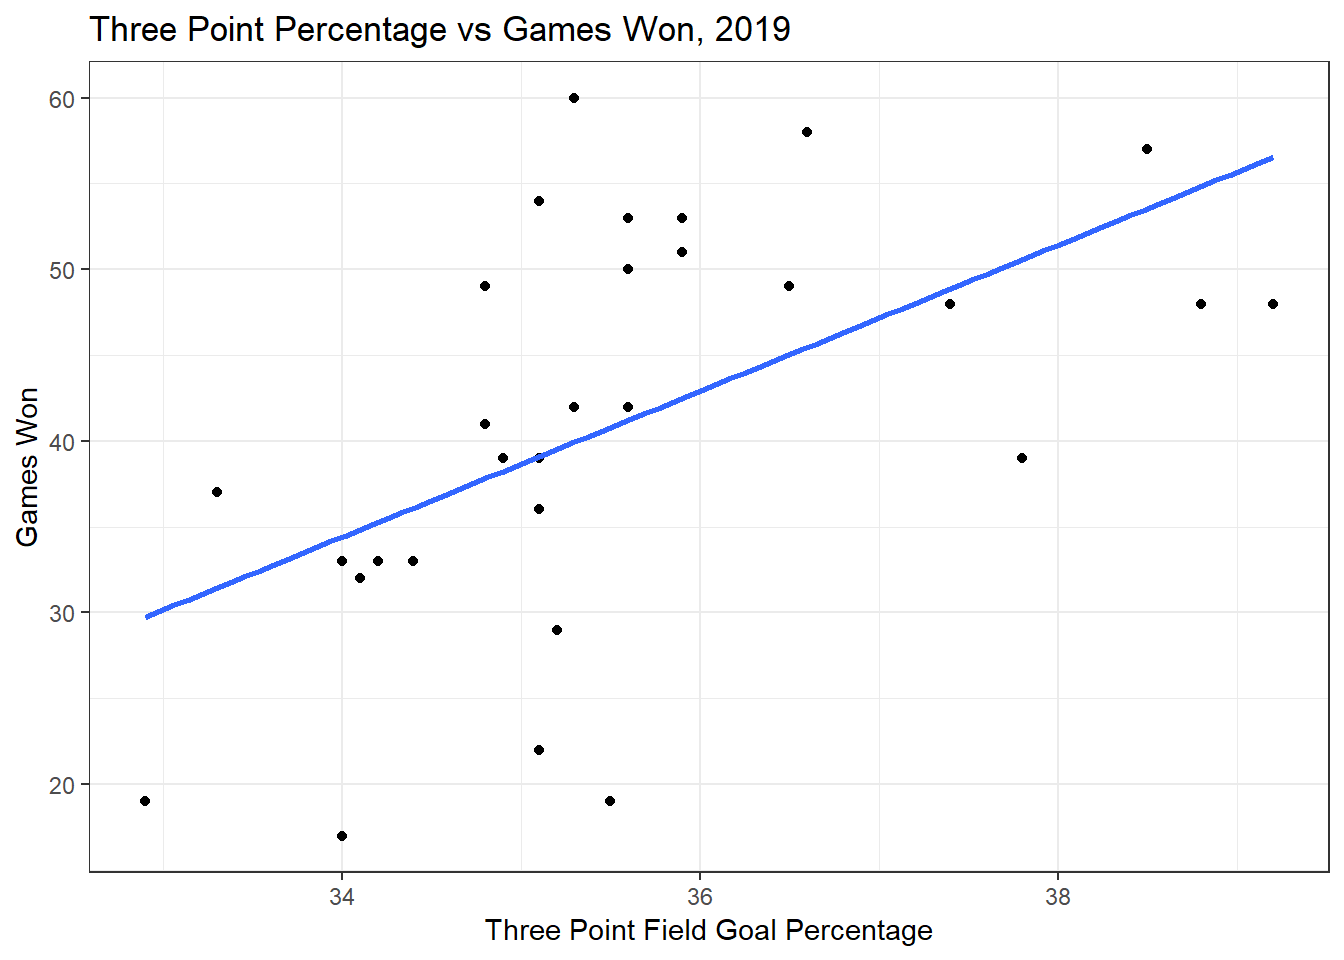
The regression model for the year 2019 has a positive slope.
Let’s see the regression lines for the different years. 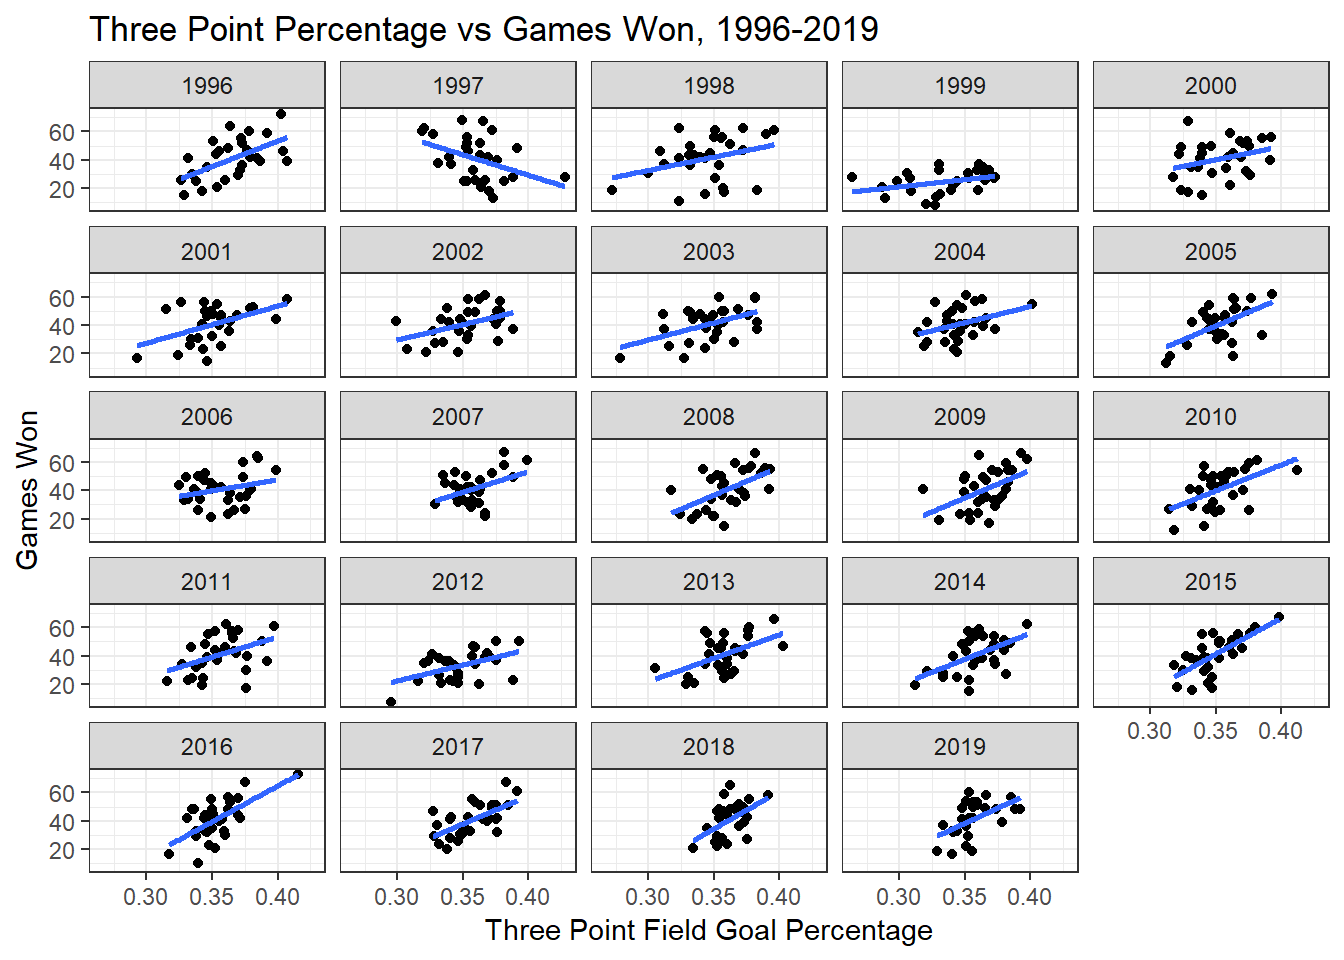
We can see that all the slopes are positive, so an increase in three point percentage means more games won, except for the year 1997.
Let’s run an anova test, to see if year is significant.
model_threes <- lm(GW~THREEPP_100*Year, data = statsAllYears)
anova(model_threes)
## Analysis of Variance Table
##
## Response: GW
## Df Sum Sq Mean Sq F value Pr(>F)
## THREEPP_100 1 22148 22148.5 176.5806 < 2.2e-16 ***
## Year 23 5674 246.7 1.9670 0.004638 **
## THREEPP_100:Year 23 7907 343.8 2.7409 2.589e-05 ***
## Residuals 663 83160 125.4
## ---
## Signif. codes: 0 '***' 0.001 '**' 0.01 '*' 0.05 '.' 0.1 ' ' 1We can see that the p-value of Year is less than .05, so year is significant.
##  Year THREEPP_100.trend    SE  df lower.CL upper.CL
##  1996              3.59 0.939 663   1.7417     5.43
##  1997             -2.88 0.942 663  -4.7288    -1.03
##  1998              1.87 0.785 663   0.3315     3.41
##  1999              1.01 0.727 663  -0.4153     2.44
##  2000              1.85 0.953 663  -0.0180     3.72
##  2001              2.60 0.890 663   0.8478     4.34
##  2002              2.17 0.950 663   0.3001     4.03
##  2003              2.41 0.869 663   0.7041     4.12
##  2004              2.27 1.174 663  -0.0351     4.58
##  2005              3.90 1.166 663   1.6130     6.19
##  2006              1.55 1.053 663  -0.5218     3.61
##  2007              2.88 1.313 663   0.3043     5.46
##  2008              3.92 1.068 663   1.8202     6.02
##  2009              3.89 1.188 663   1.5566     6.22
##  2010              3.65 1.068 663   1.5506     5.74
##  2011              2.83 1.060 663   0.7474     4.91
##  2012              2.21 0.938 663   0.3707     4.06
##  2013              3.30 1.069 663   1.1990     5.40
##  2014              3.64 1.100 663   1.4839     5.80
##  2015              5.08 1.131 663   2.8581     7.30
##  2016              5.02 1.171 663   2.7207     7.32
##  2017              3.95 1.153 663   1.6840     6.21
##  2018              5.28 1.843 663   1.6626     8.90
##  2019              4.25 1.357 663   1.5888     6.92
##
## Confidence level used: 0.95
Looking at the different regression slopes (THREEPP_100.trend) for the different years, we can see the 2015-2019 have a significantly higher regression slopes than of previous years.